16.3.1 Sensitivity analysis - Simple valuation technique
A limited sensitivity analysis has been undertaken for the Total Project PSC (i.e. including Retained Risk), on the main cost components of the Risk Adjusted PSC so as to understand the effect that movement in these costs will have on the cost of the Project. The results of this analysis are detailed in Table 16-5.
Table 16-5: Sensitivity analysis of the effect of movement of cost components on project cost
Movement in assumption | Capital cost | Operating cost | Discount rate | Inflation rate | Maintenance and refurbishment |
-15% | 418.1 | 448.6 | 479.9 | 466.1 | 455.2 |
-10% | 434.1 | 454.4 | 475.2 | 466.1 | 458.8 |
-5% | 450.1 | 460.2 | 470.6 | 466.1 | 462.5 |
Base case | 466.3 | 466.3 | 466.3 | 466.3 | 466.3 |
5% | 482.1 | 471.9 | 461.6 | 466.0 | 469.7 |
10% | 498.0 | 477.7 | 457.2 | 466.0 | 473.3 |
15% | 514.0 | 483.5 | 453.0 | 466.0 | 477.0 |
Figure 16-5 shows how change in the key variables for the model (mentioned above) imp on the total risk-adjusted PSC. Steeper gradients indicate that the NPC of the PSC is m sensitive to changes in this variable than to other variables tested.
Figure 16-5: Sensitivity chart - Impact of changes in variables on the total risk-adjusted PSC
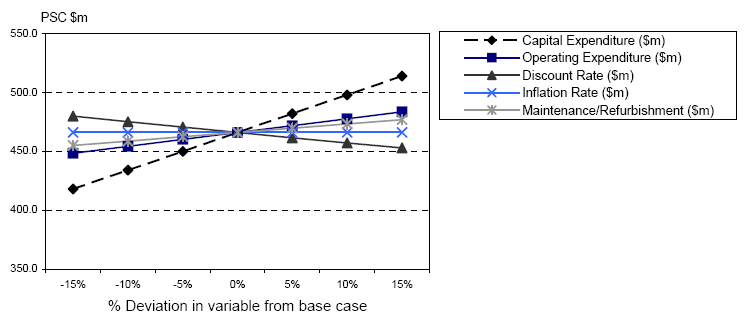
This analysis indicates the following:
(i) Project capital costs
Every 5 per cent change in the capital cost of the Project, produces a change of approximately $16 million in the total project cost. Figure 16-5 above shows a steeper gradient for this cost compared with the other variables being tested. This means that the total PSC is more sensitive to changes in this variable than to changes in other variables. This result corresponds with the significant proportion of the total PSC which relates to capital costs, i.e. 51 per cent.
(ii) Project operating costs
Figure 16-5 shows that the PSC is less sensitive to changes in project operating costs than changes to the project capital costs, illustrated by the flatter gradient. Every 5 per cent change in the base operating cost produces a $6 million change approximately in the total PSC.
(iii) Discount rate
Figure 16-5 clearly illustrates the inverse relationship between the discount rate and the NPC of the project, i.e. the larger the discount rate, the lower the NPC. The gradient of this line indicates that for every 5 per cent increase/decrease in the discount rate, the change in the PSC is approximately $5 million lower/higher than the base case.
(iv) Inflation rate
The flat gradient shows that a 5 per cent change in the inflation rate has minimal effect on the overall PSC, which suggests that the PSC is not sensitive to changes in this variable.
(v) Maintenance and refurbishment costs
An increase/decrease of 5 per cent in this cost produces a corresponding increase/decrease of nearly $3 million on the total PSC, but as can be seen on the graph, the gradient of this cost is flatter than for the other variables tested, except for inflation. This suggests that the PSC is less sensitive to maintenance and refurbishment costs relative to the other costs tested, except for inflation.
In summary, the project PSC is more sensitive to movements in the project's capital cos compared with other variables. These results should be reviewed with some caution because each variable is analysed separately. However, in reality these costs are often dependent on each other.