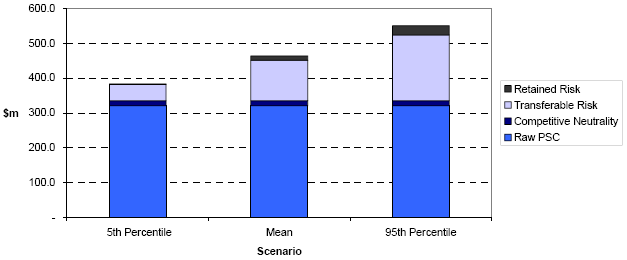
Risk Adjusted Public Sector Comparator
5th Percentile | Mean | 95th Percentile | ||||
($m) | % | ($m) | % | ($m) | % | |
320.6 | 84% | 320.6 | 69% | 320.6 | 58% | |
15.0 | 4% | 15.0 | 3% | 15.0 | 3% | |
Transferable Risk | 46.1 | 12% | 116.0 | 25% | 188.9 | 34% |
2.3 | 1% | 12.8 | 3% | 27.0 | 5% | |
Risk Adjusted PSC | 384 | 100% | 464 | 100% | 552 | 100% |
Notes
1. @Risk simulations have been run to determine transferable and retained risk
2. The 5% confidence limit is reported as the "Best Case"
3. The Mean is reported as the "Most Likely Case"
4. The 95% confidence limit is reported as the "Worst Case"