Sensitivity Analysis - Results
% Deviation in Variable from Base Case | ||||||||
-15% | -10% | -5% | 0% | 5% | 10% | 15% | ||
Capital Expenditure | ($m) | 427.4 | 439.7 | 452.1 | 464.4 | 476.7 | 489.1 | 501.4 |
Operating Expenditure | ($m) | 451.1 | 455.5 | 460.0 | 464.4 | 468.8 | 473.3 | 477.7 |
($m) | 478.6 | 474.4 | 467.5 | 464.4 | 458.7 | 455.2 | 449.2 | |
Inflation Rate | ($m) | 466.5 | 465.1 | 464.6 | 464.4 | 463.6 | 462.5 | 461.9 |
Maintenance/Refurbishment | ($m) | 455.8 | 458.7 | 461.5 | 464.4 | 467.3 | 470.1 | 473.0 |
Sensitivity Chart
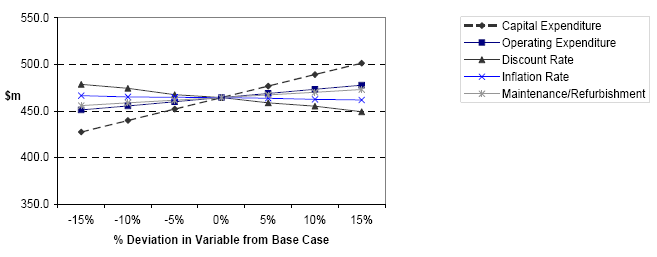
Note: The slight fluctuations in the discount rate and inflation rate variables are due to the need to re-run the @Risk simulations for each change in the variables to estimate the transferable and retained risk.